Netdata: open-source monitoring that watches every metric, every second
Netdata is open-source monitoring that auto-discovers metrics, collects them every second, and flags anomalies with unsupervised ML trained at the edge.
Project facts
GitHub Ecosystem- License
- GPL-3.0
- Language
- Go
- Stars
- 80,761
- Data checked
- 2026-09-30
Snapshot figures reflect the check date and may change over time.
When a server pages you in the middle of the night, the alert is rarely the hard part — the diagnosis is. You end up hopping between CPU, memory, container, and database dashboards to find the culprit. Netdata puts collection, dashboards, and anomaly detection in a single agent: developed since 2013, written in Go, with 80,761 stars as of 2026-09-30. One command installs it, it auto-discovers every system and application metric on the node, and it collects and charts them per second. The mechanism worth watching is the anomaly detection: with no labeled data, the agent trains multiple unsupervised models per metric right on the node, and behavior that drifts from the learned baseline gets flagged. The WeChat account AI开源求索 recommended it on 2026-10-01 as zero-config AI monitoring with 80.8K stars.
Core features
Netdata’s capabilities line up along the path from install to alert.
- Zero-configuration discovery: the moment the agent starts, it scans its node — system resources, disks, network, processes, containers (Docker, containerd, Kubernetes) — plus packaged applications such as nginx, postgres, and redis. The official capability table lists 800+ integrations, and you write no collection config.
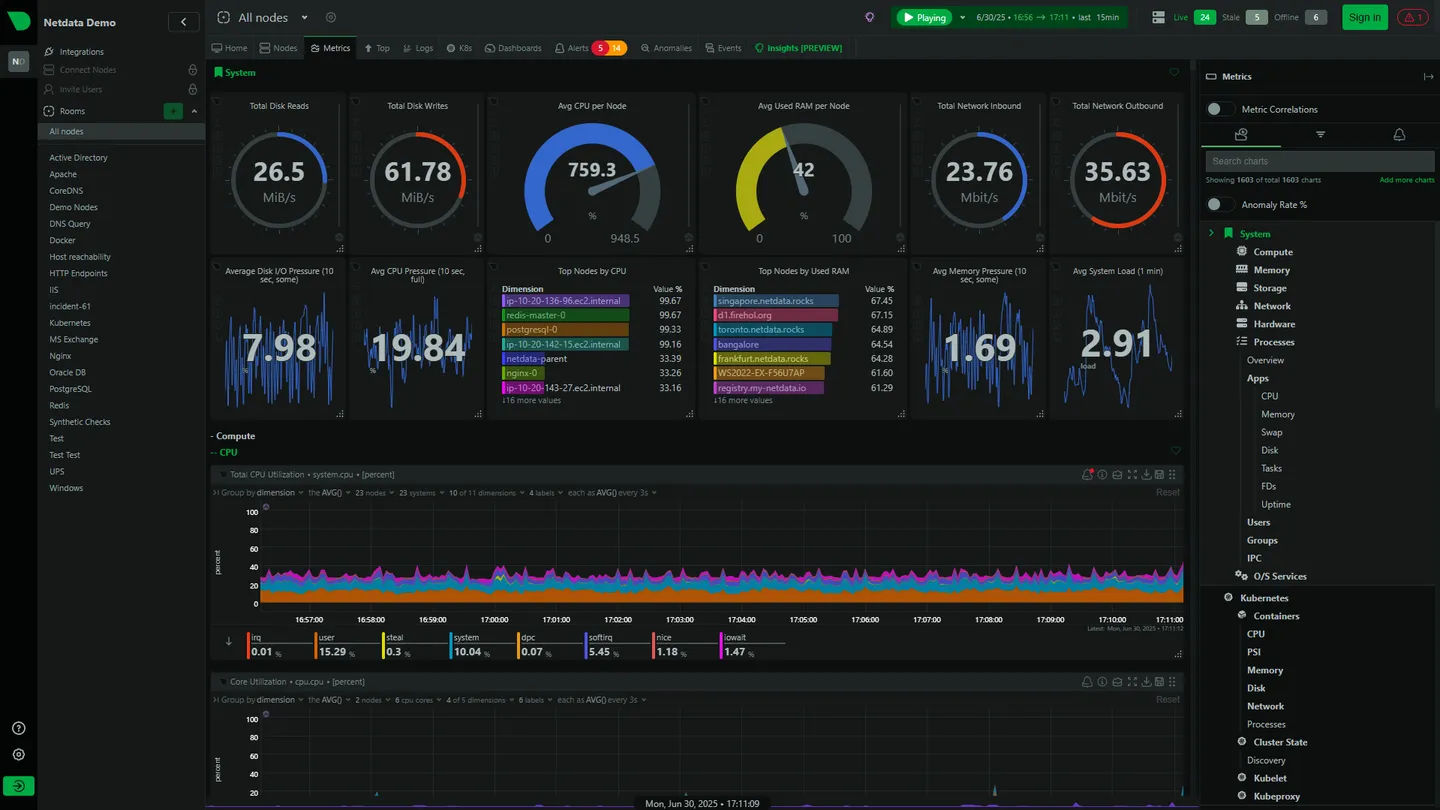
- Per-second granularity: collection and visualization at 1-second resolution, so incident review keeps the detail that minute averages smooth over. Netdata also runs 7 demo sites (Frankfurt, Singapore, and more) on default configuration, so you can see real data before installing anything.
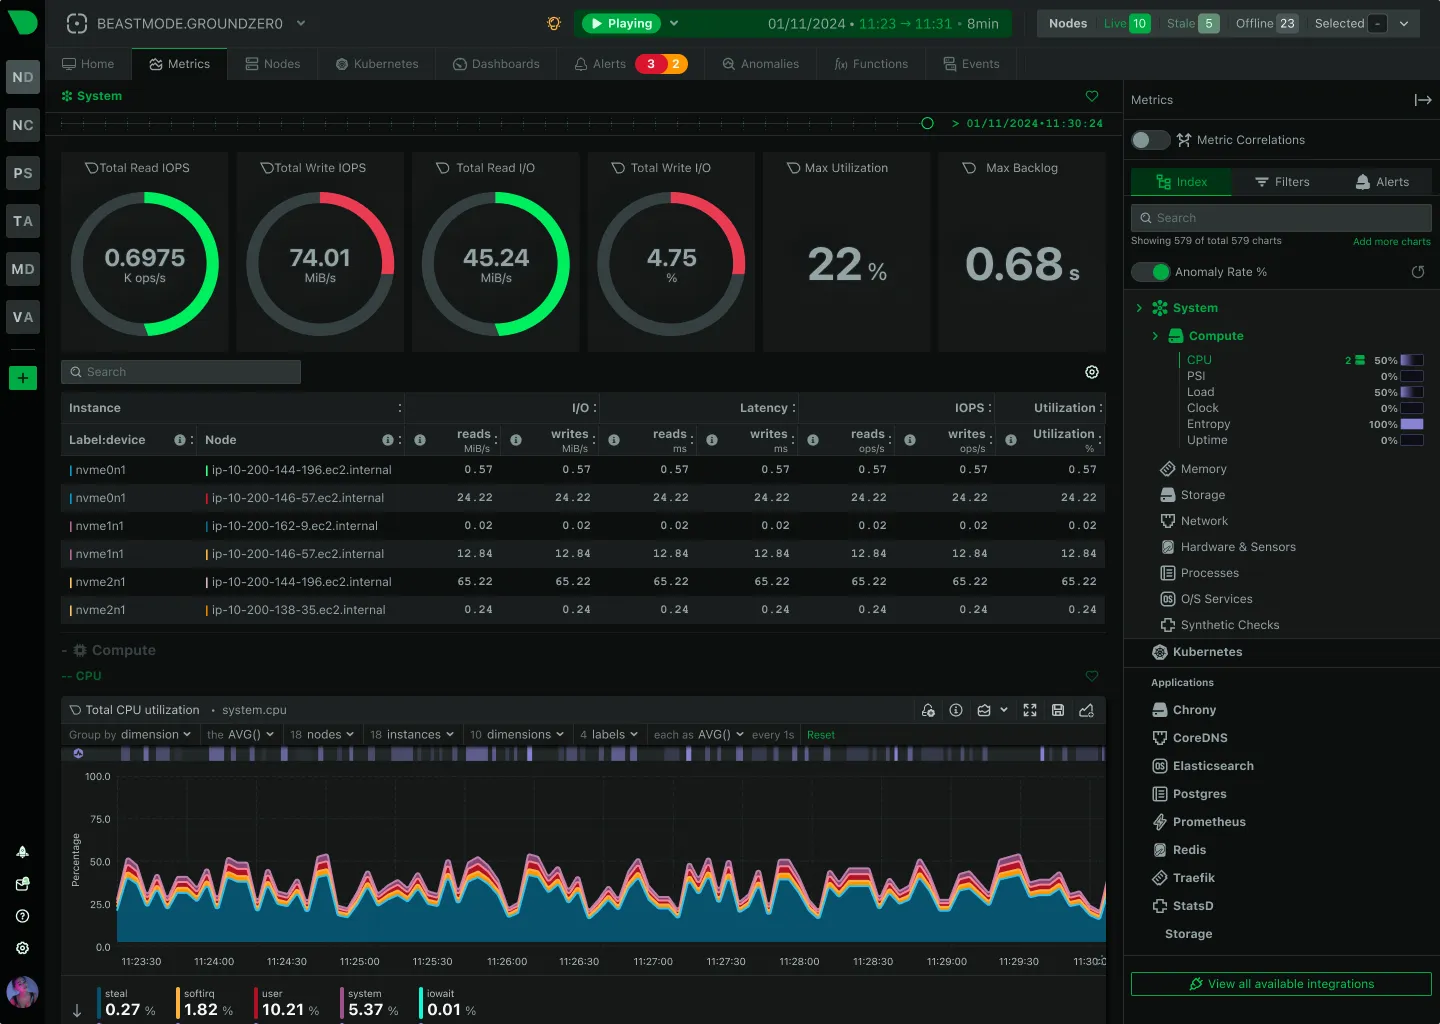
- Edge ML anomaly detection: every metric gets unsupervised k-means models trained locally. There are 18 models per metric, each trained on the last 6 hours and refreshed every 3 hours, covering roughly 54 hours of behavior; an anomaly is flagged only when all models agree, which the docs credit with eliminating about 99% of false positives. Anomaly rates overlay every chart.
- Alerts built in: hundreds of pre-configured alert rules ship with the agent, and notifications go to email, Slack, Telegram, PagerDuty, Discord, Microsoft Teams, and more — email works by default once an MTA is configured.
- Efficient storage: tiered storage at roughly 0.5 bytes per sample, with Tier 0 (per-second), Tier 1 (per-minute), and Tier 2 (per-hour) queried automatically by zoom level. The README FAQ puts the default overhead at about 5% of one CPU core plus 150MiB of RAM on production systems, and a 2023 University of Amsterdam study (an ICSOC paper) ranked it the most energy-efficient tool for monitoring Docker-based systems.
- Scales and exports: Parent-Child centralization merges many nodes into one dashboard with longer retention, and metrics can be archived to Prometheus, InfluxDB, Graphite, and others.
Typical use cases
Netdata shows up most often where there’s no dedicated ops person.
- Solo developers and homelabs: an agent on each VPS or NAS, the dashboard at
http://localhost:19999, alerts pushed to Telegram — no more SSH-ing in to run top. - Small teams on containers: agents on Kubernetes or Docker hosts, plus the free Netdata Cloud community tier to merge nodes into one view, centralize alerts, and hand teammates RBAC accounts — the metrics themselves stay on your infrastructure.
- Adding detail to a Prometheus stack: the agent handles per-second collection and edge anomaly detection while long-term trends still archive to Prometheus; for an outside-in health check of a public site, pair it with Web-Check, a website audit tool on this site.
Quick start
Netdata installs with a single command, the official kickstart script:
wget -O /tmp/netdata-kickstart.sh https://get.netdata.cloud/kickstart.sh && sh /tmp/netdata-kickstart.sh
Once it’s up, open http://localhost:19999 — the dashboard is already full of per-second metrics for the node. If you prefer containers, run it with the host mounts from the official Docker guide:
docker run -d --name=netdata \
  --pid=host \
  --network=host \
  -v netdataconfig:/etc/netdata \
  -v netdatalib:/var/lib/netdata \
  -v netdatacache:/var/cache/netdata \
  -v /:/host/root:ro,rslave \
  -v /etc/passwd:/host/etc/passwd:ro \
  -v /etc/group:/host/etc/group:ro \
  -v /etc/localtime:/etc/localtime:ro \
  -v /proc:/host/proc:ro \
  -v /sys:/host/sys:ro \
  -v /etc/os-release:/host/etc/os-release:ro \
  -v /var/log:/host/var/log:ro \
  -v /var/run/docker.sock:/var/run/docker.sock:ro \
  -v /run/dbus:/run/dbus:ro \
  --restart unless-stopped \
  --cap-add SYS_PTRACE \
  --cap-add SYS_ADMIN \
  --security-opt apparmor=unconfined \
  netdata/netdata
One thing to know up front: the official security design doc says direct agent access is “typically unauthenticated, relying on LAN isolation or firewall policies”, and suggests placing agents behind an authenticating web proxy — don’t expose port 19999 raw to the internet.
Summary
Netdata fits anyone who wants per-second monitoring without assembling collectors and dashboards themselves: personal servers, homelabs, and small teams without a dedicated SRE. The demo sites let you judge the UI before installing. Development started on 2013-06-17, the repo was still taking pushes on 2026-09-30, and it’s a CNCF member project with one of the highest star counts in the CNCF landscape.
Four things to know first. Anomaly detection has a learning period: the 18-model consensus takes about 54 hours to fill in, so the first two days after install are incomplete. For multi-quarter trend analysis, the Prometheus and Grafana ecosystems are more mature — Netdata’s bet is per-second collection that works out of the box, the official comparison post lays out the trade-offs, and the agent can archive metrics to Prometheus so you get both. The free Netdata Cloud community tier handles users, RBAC, and centralized alerts, but the account layer lives in their cloud; for a fully offline setup, the docs describe disabling telemetry, skipping Cloud, and turning off auto-updates. Licensing splits by component: the agent core is GPL v3+, the dashboard UI is closed-source but free with the agent, and Cloud is closed-source — check before redistributing or building deep integrations.